Prime Minister Boris Johnson's Conservatives have a majority of 80 seats.
They have made gains in Labour heartlands across northern England and Wales. The SNP have made gains across Scotland.
Labour have had their worst return of seats in any general election since 1935.
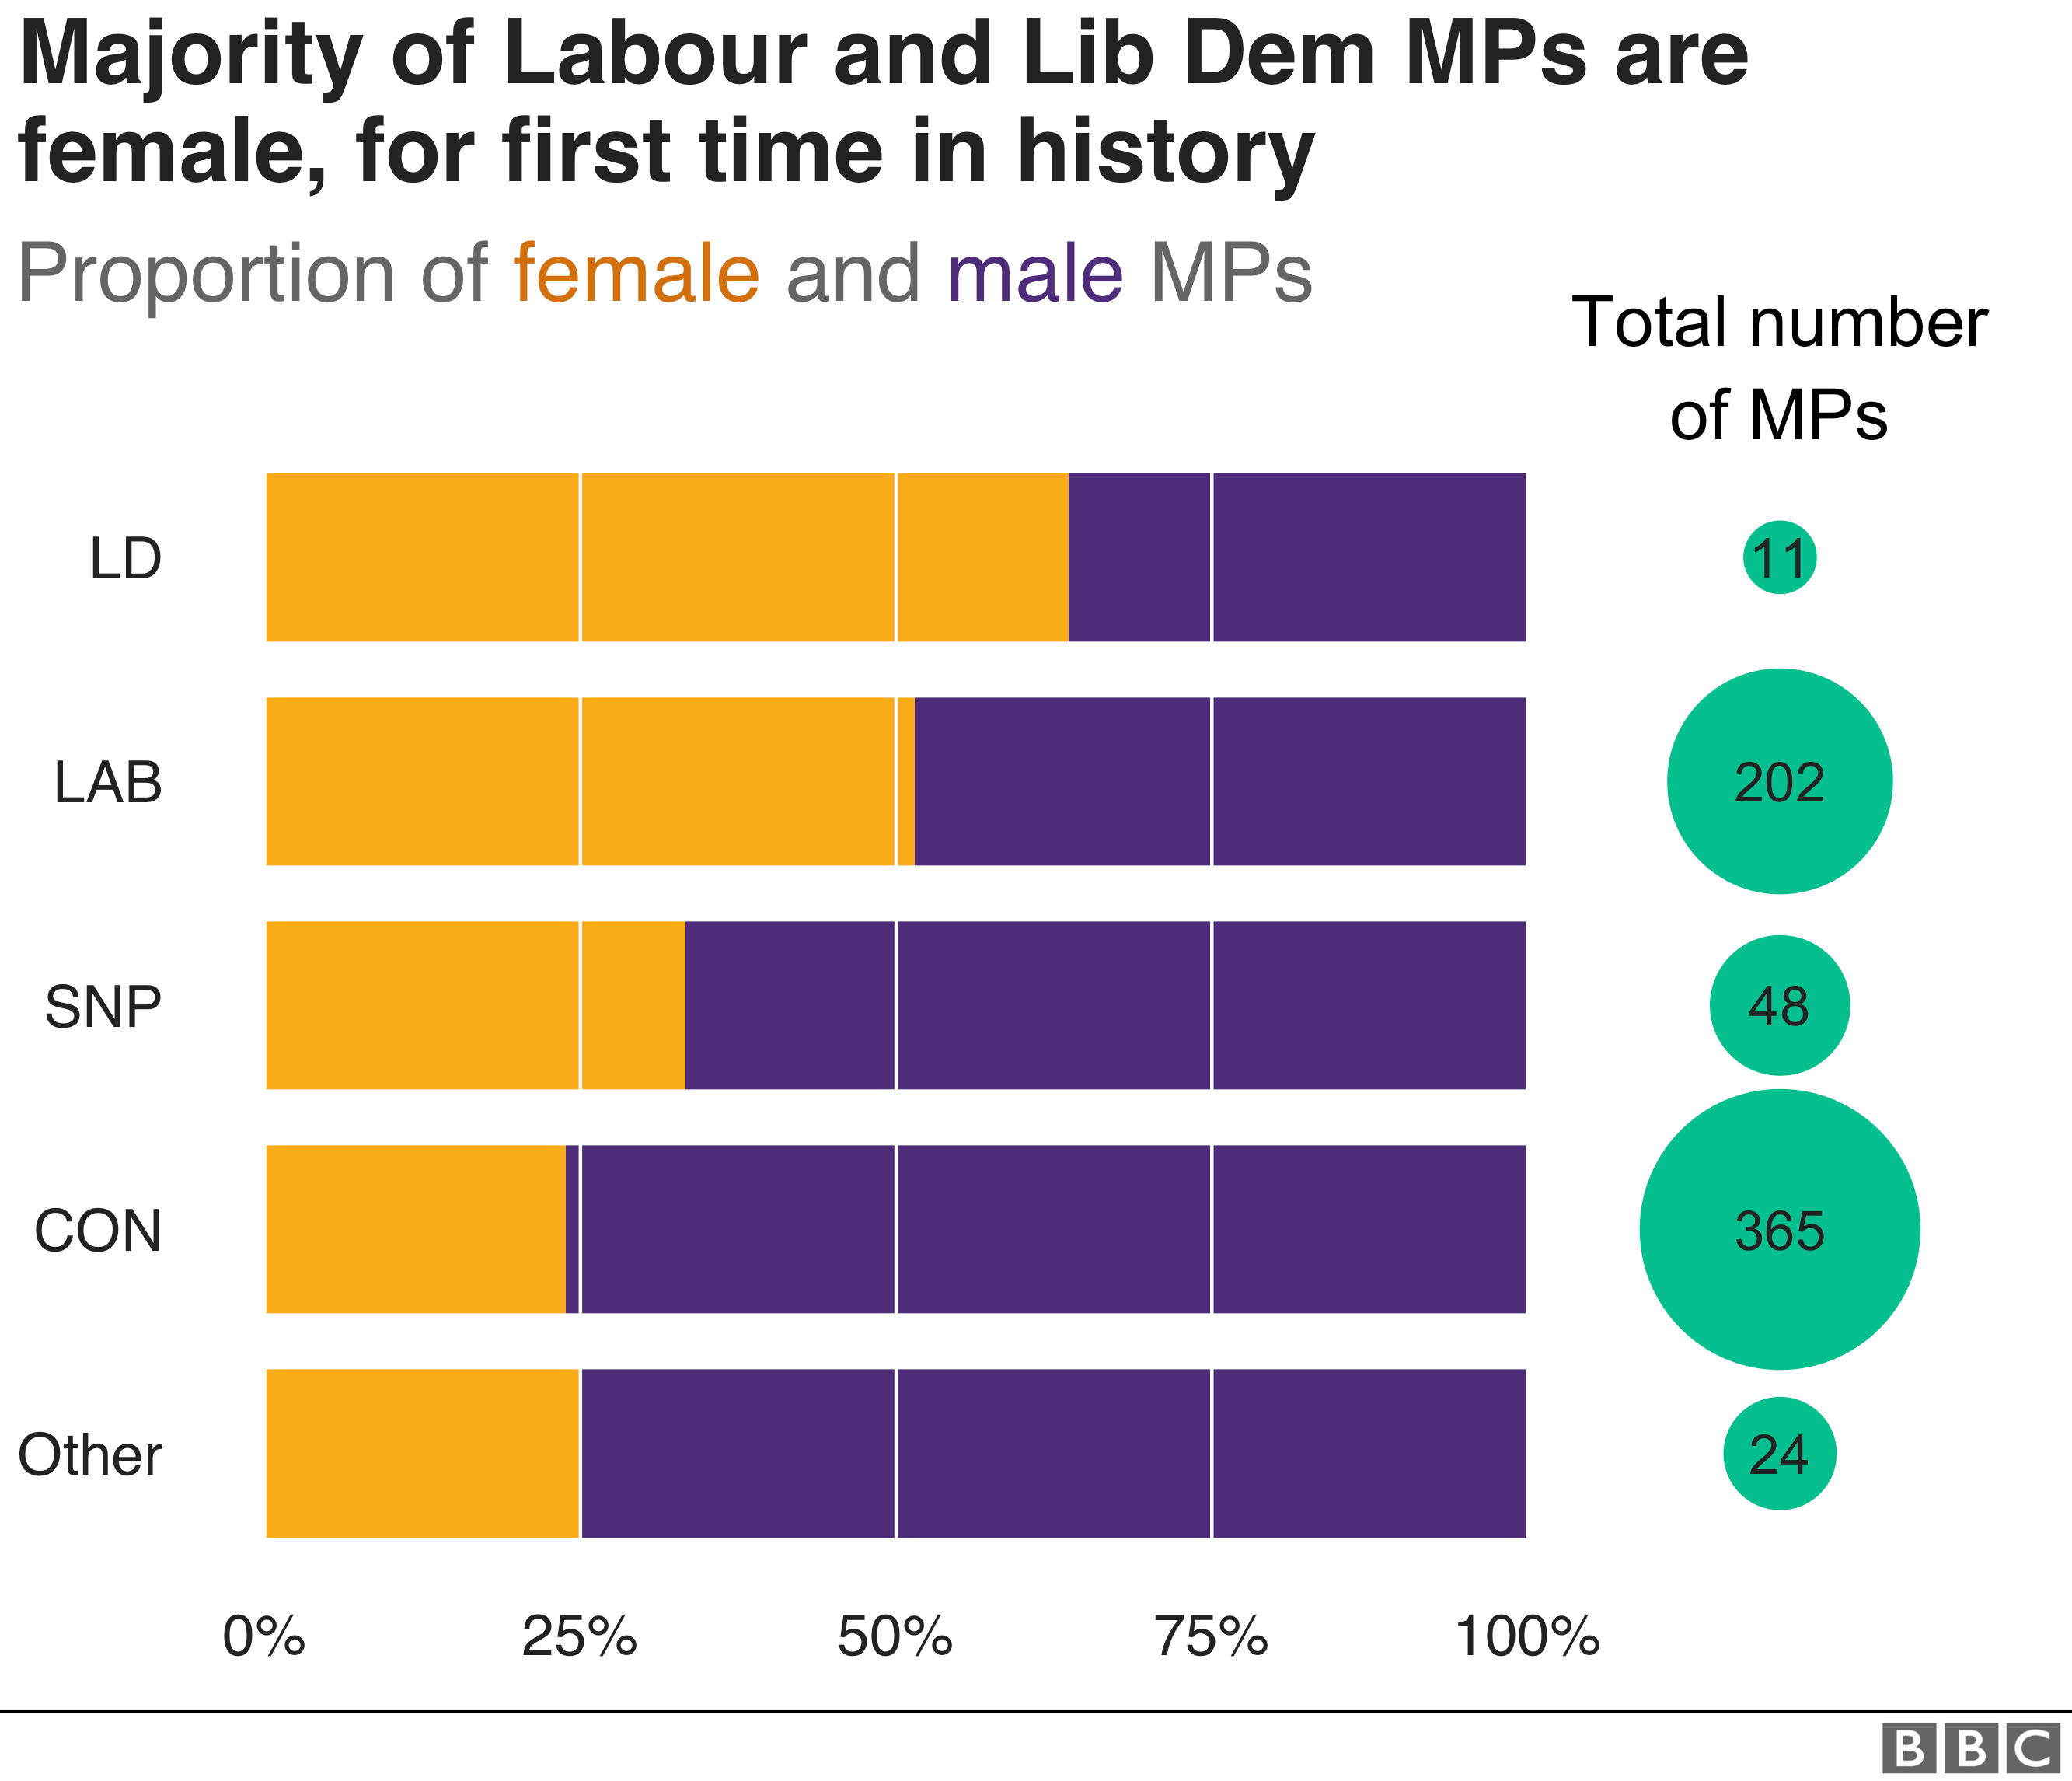
Both Labour and the Liberal Democrats now have more female than male MPs.
The interactive map below shows all the seats that have changed from one party to another. Select the "results" tab to see what has happened in the rest of the UK.
The Brexit effect
The Conservatives increased their vote share in many areas that voted Leave in the 2016 EU referendum.
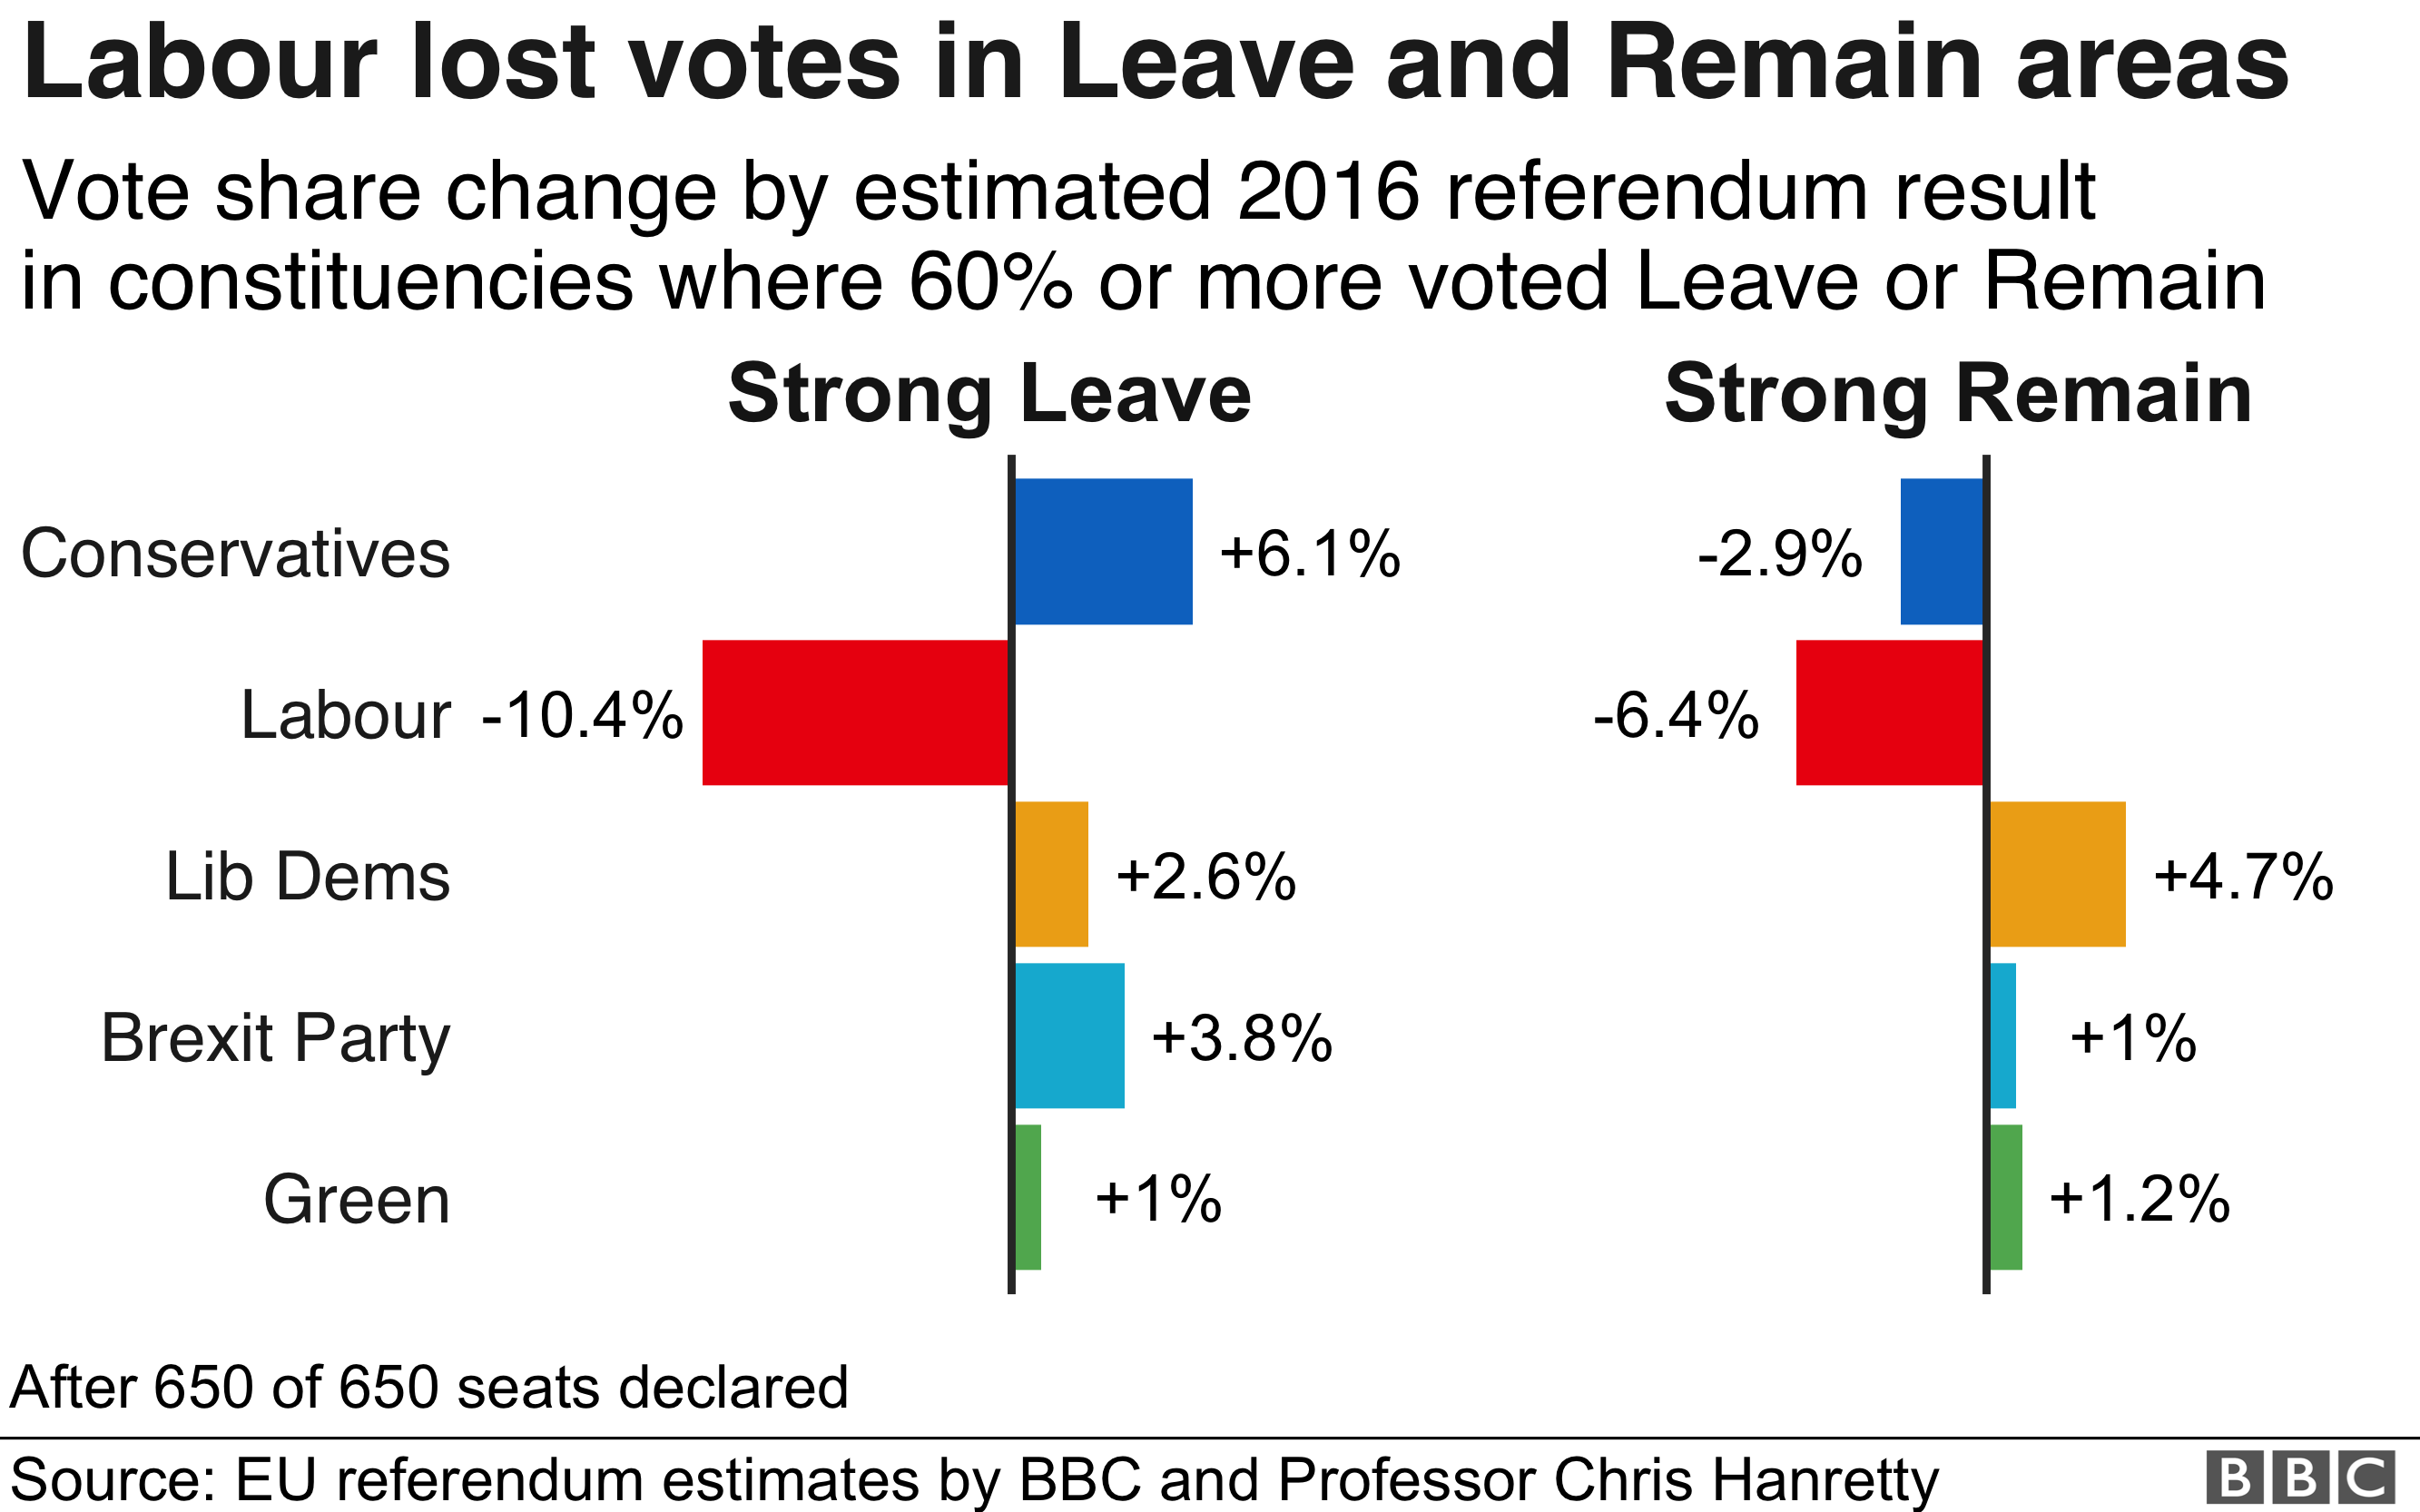
By contrast they lost votes in strong Remain constituencies such as those in Scotland and London. But Labour lost votes in both strong Remain and strong Leave areas.
Strong Leave and strong Remain constituencies are those where an estimated 60% or more of the electorate voted for that option at the EU referendum.
These estimates of constituency Brexit votes were modelled by Professor Chris Hanretty, as the 2016 referendum result was only recorded by local authority and not by Westminster constituency.
The Conservatives were clear winners in constituencies estimated to have voted majority Leave in 2016. They won almost three quarters of all these seats.
By contrast, there was no clear winner among Remain backing constituencies, with a crowded field of parties all winning substantial numbers of seats.
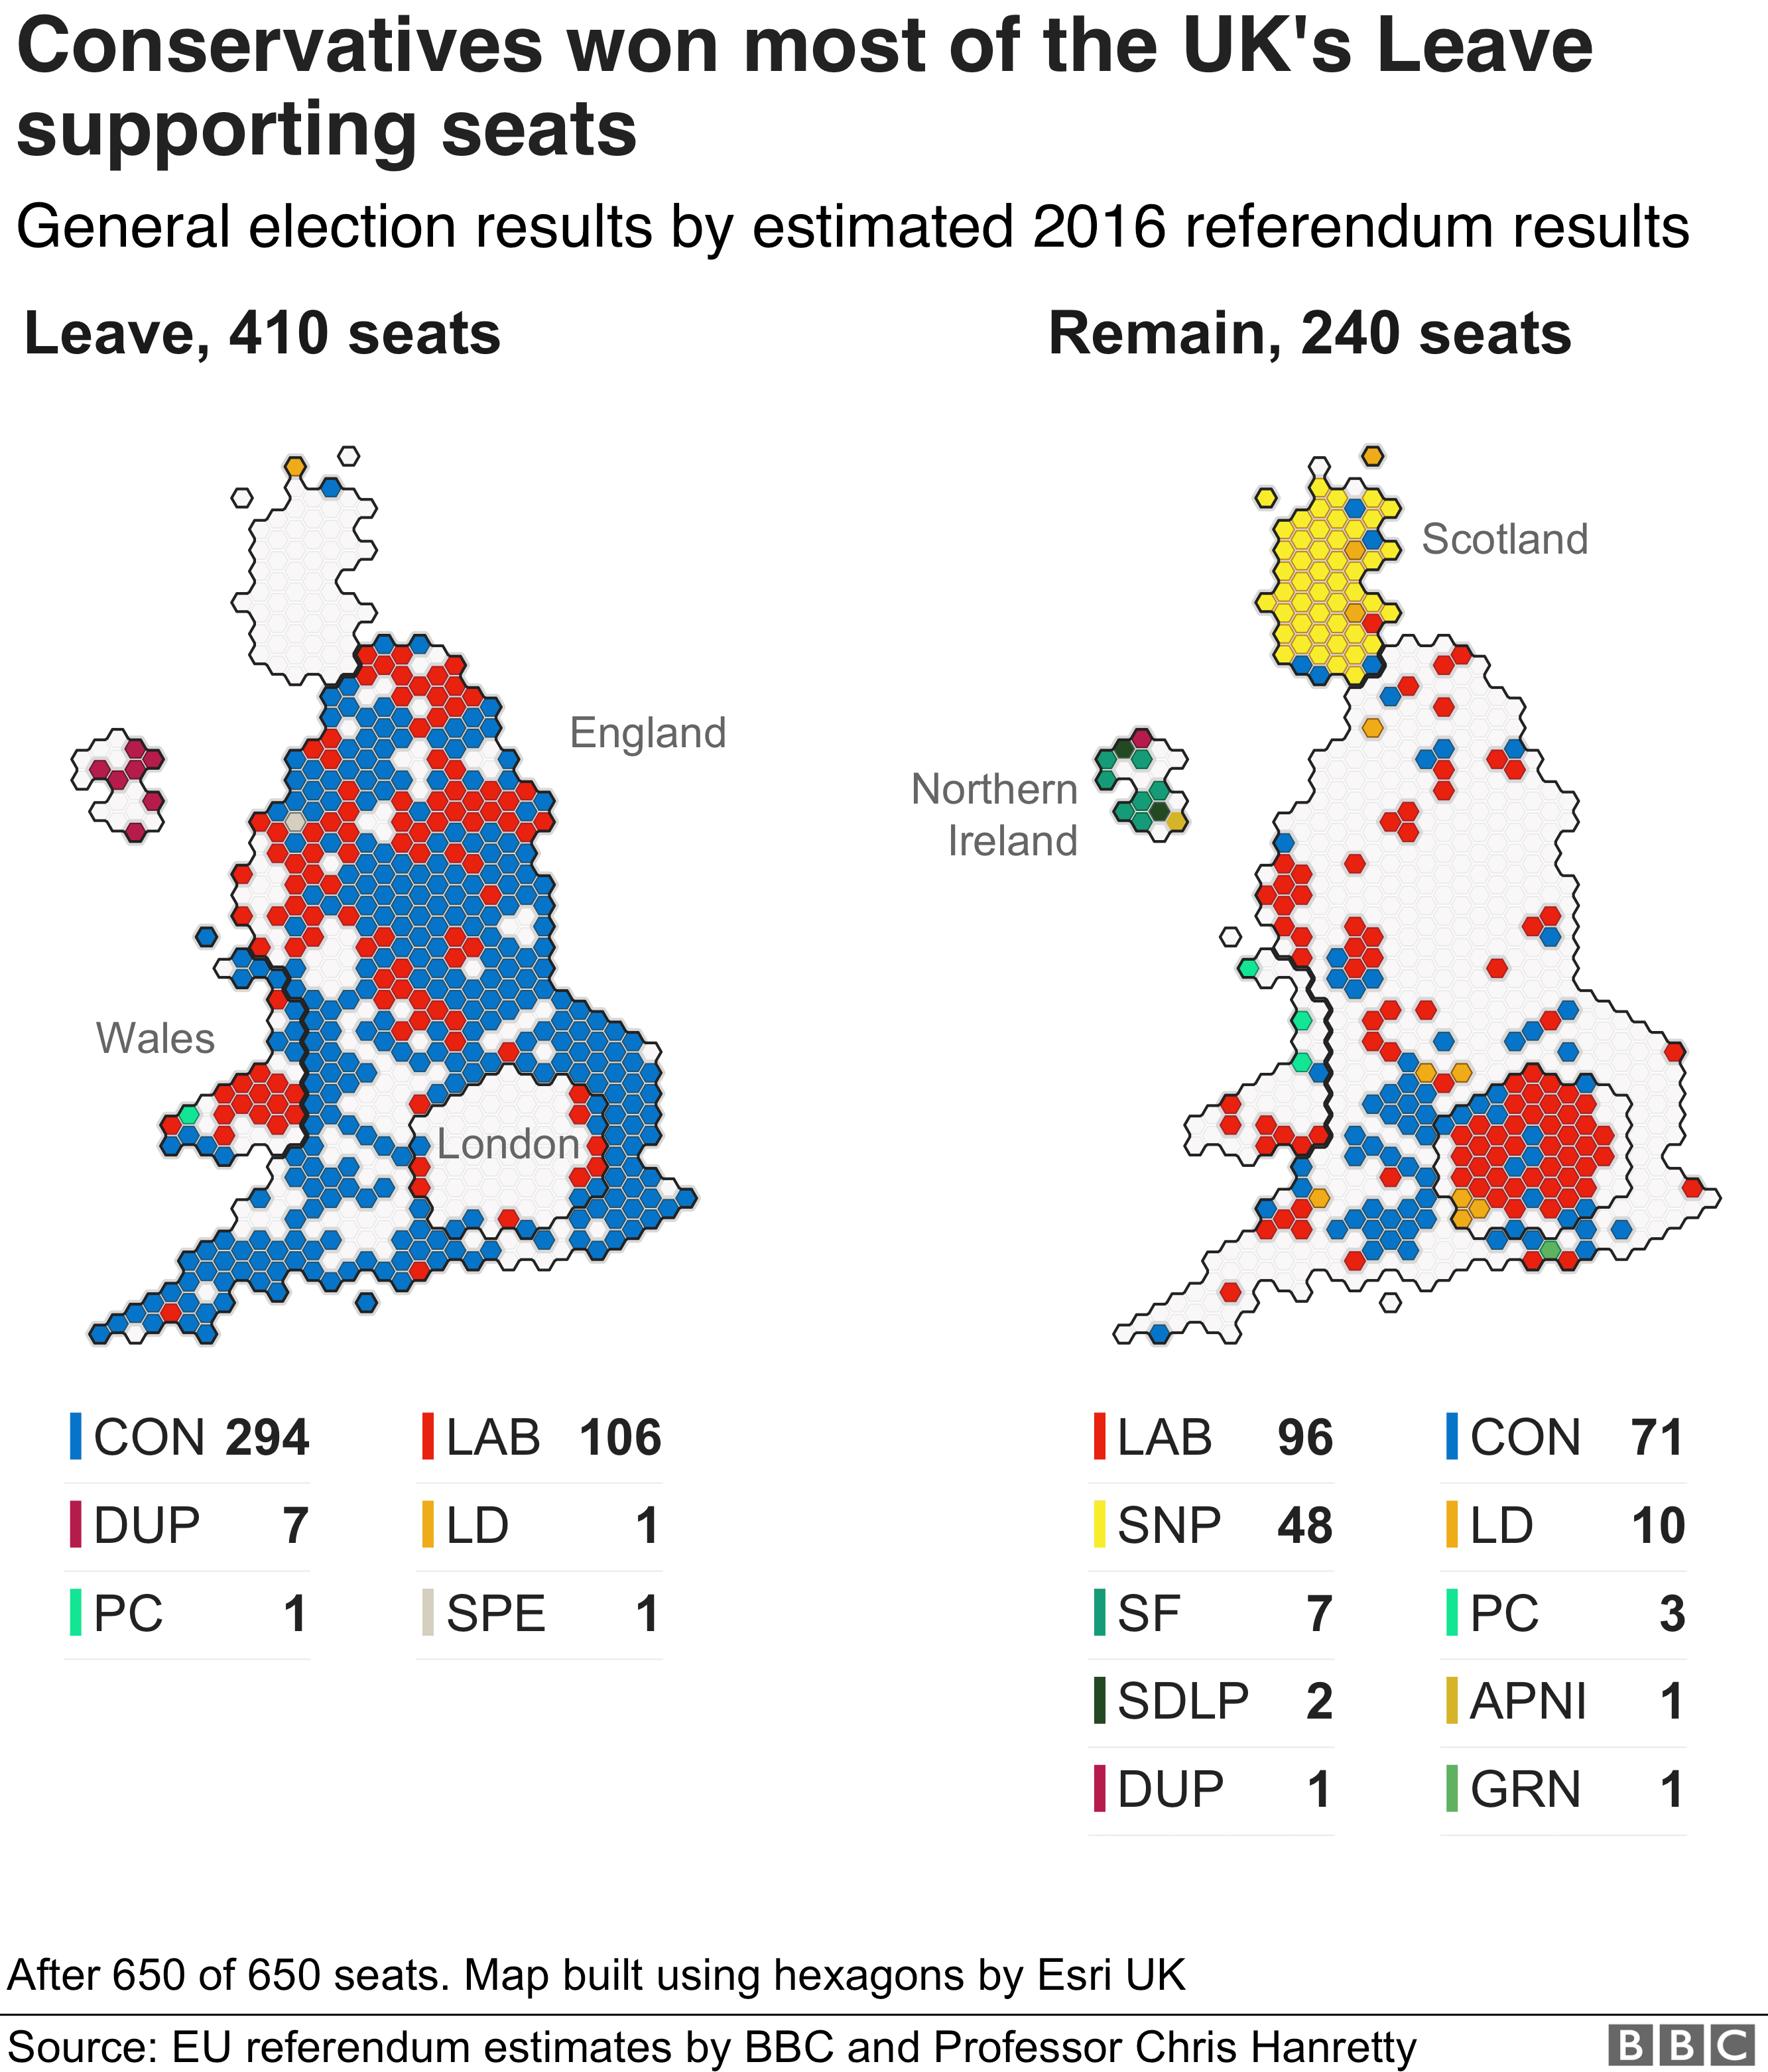
Labour did best of all those parties but only took 40% of the constituencies that backed Remain.
Labour also straddled the Brexit divide taking a roughly equal number of Leave (106) and Remain (96) seats.
Most other parties had a clearer Brexit divide.
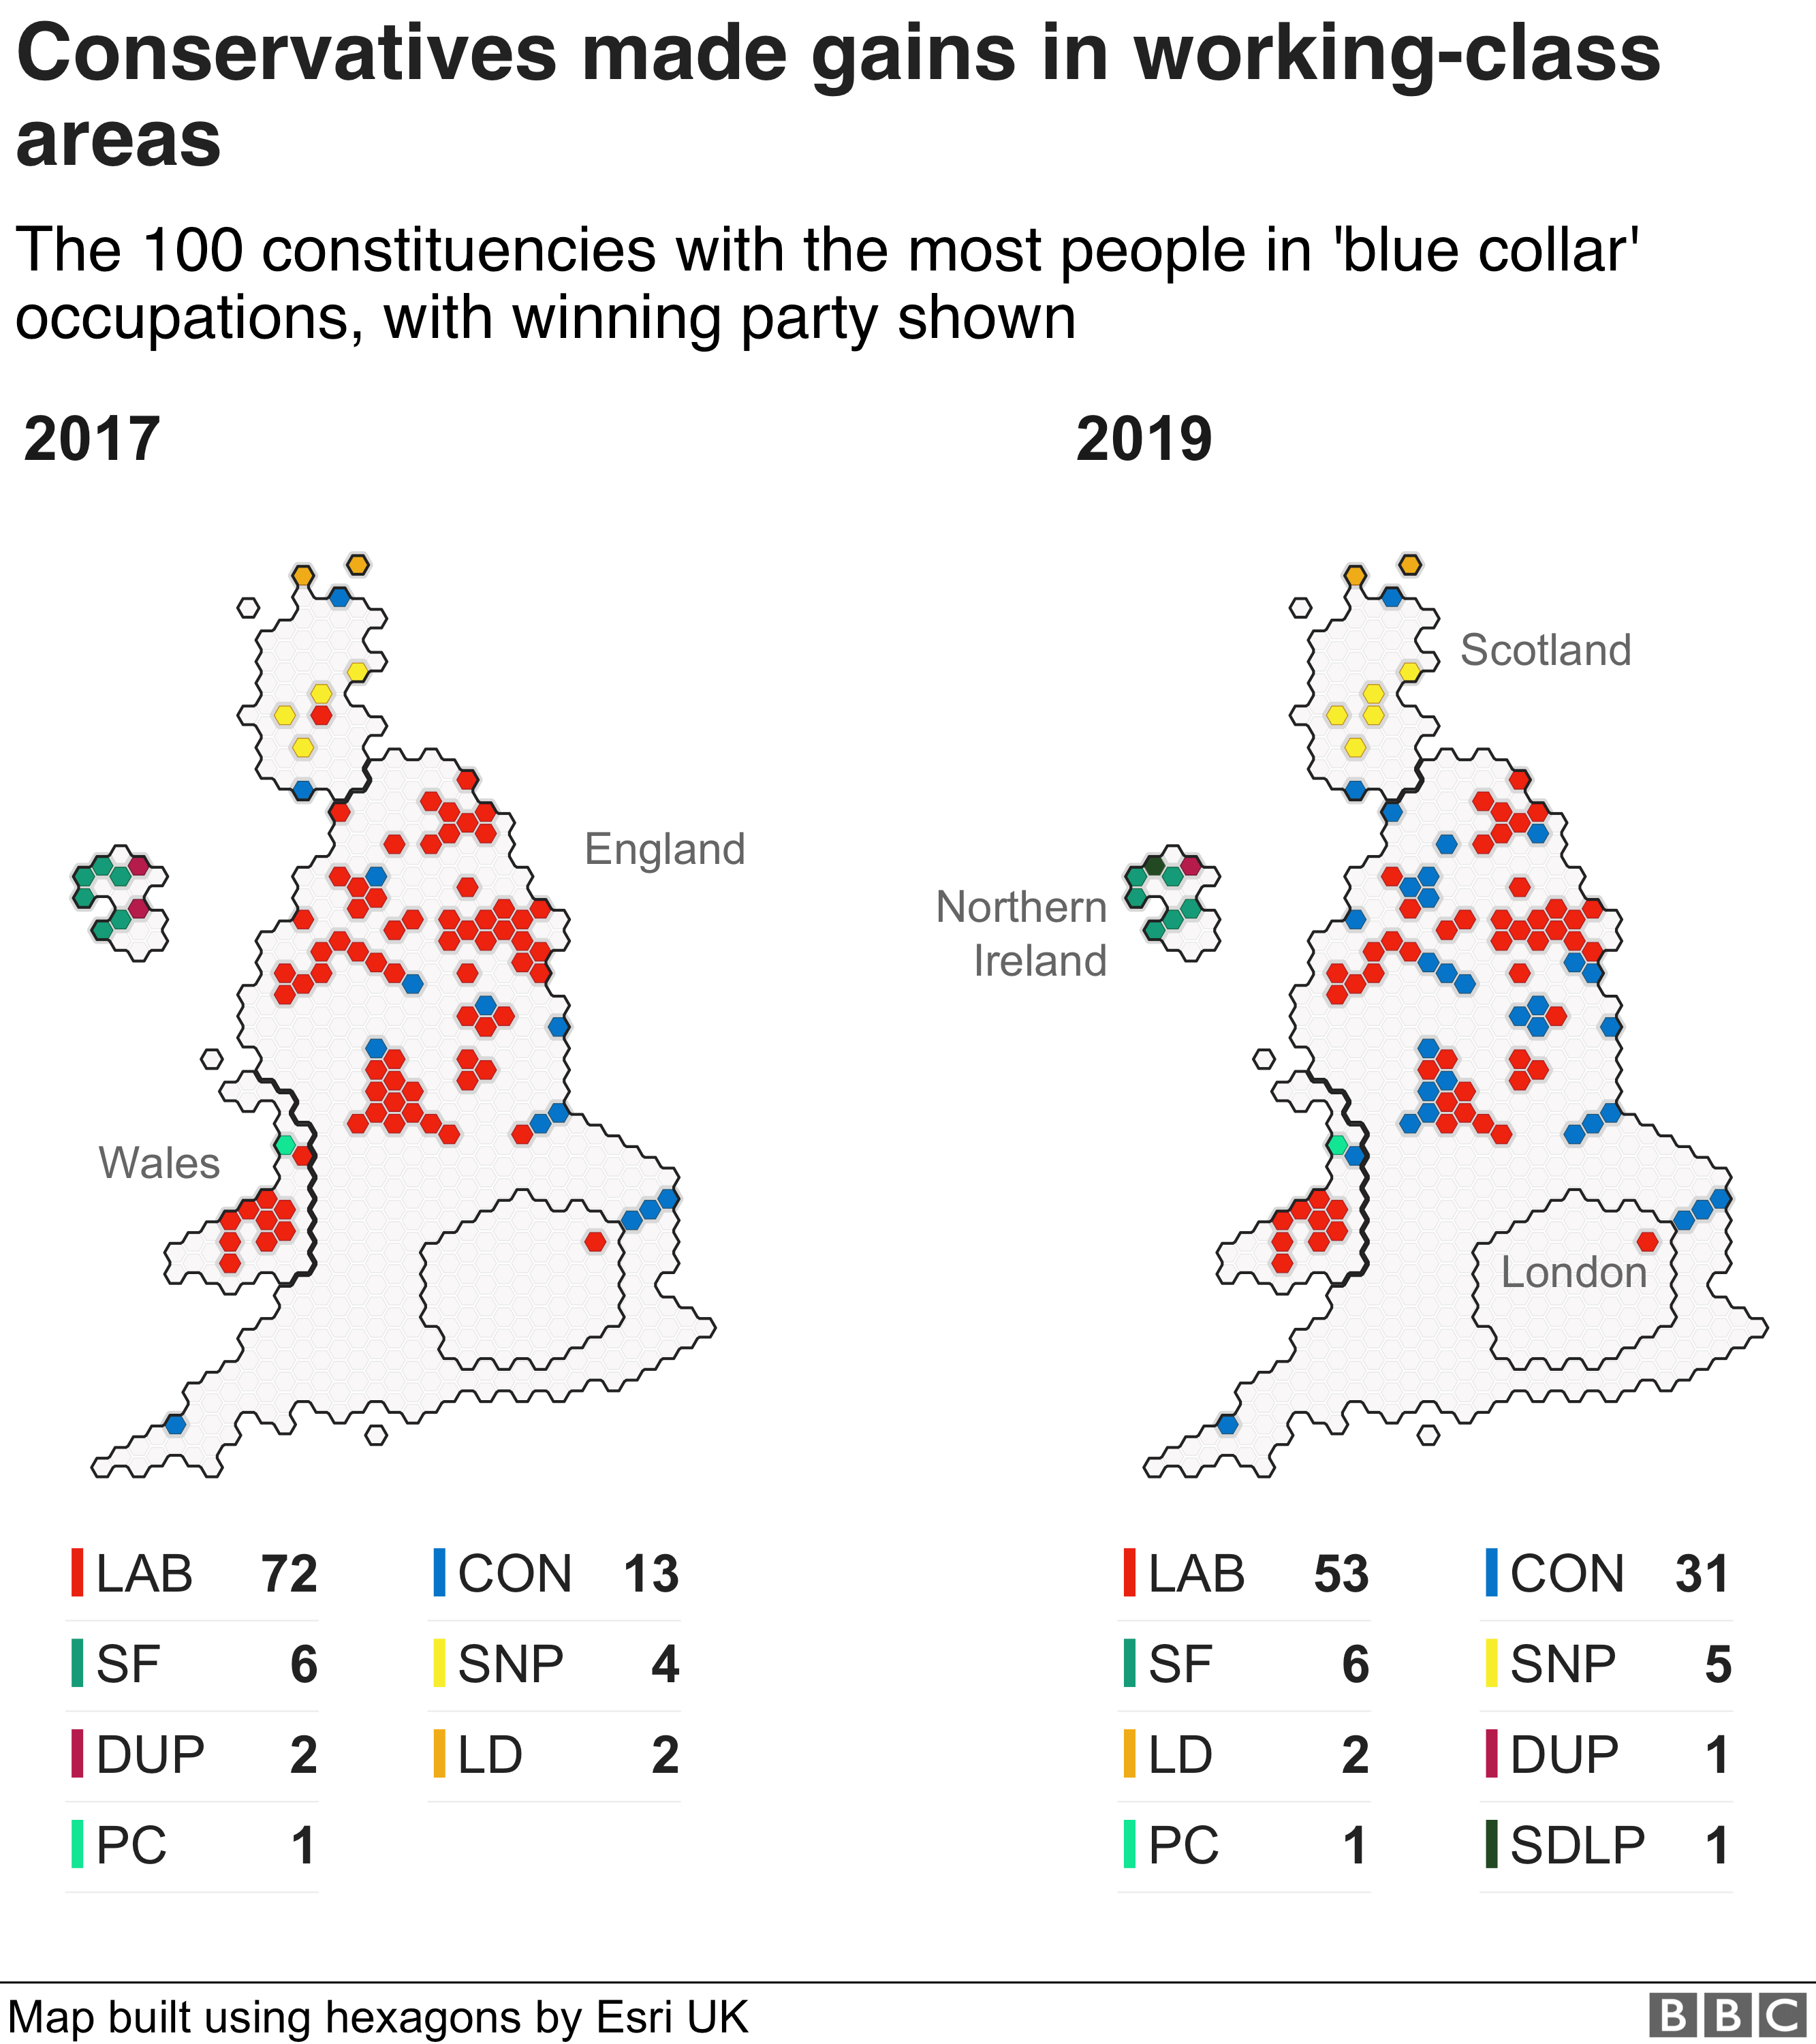
Overall, the Conservatives broke new ground, moving into many traditional Labour heartlands.
In 2017, Labour held 72 of the 100 constituencies with the most working class households (defined as C2DE using data from the 2011 census).
In 2019, this figure fell to 53 and the Conservatives increased their share from 13 to 31.
The nations and regions
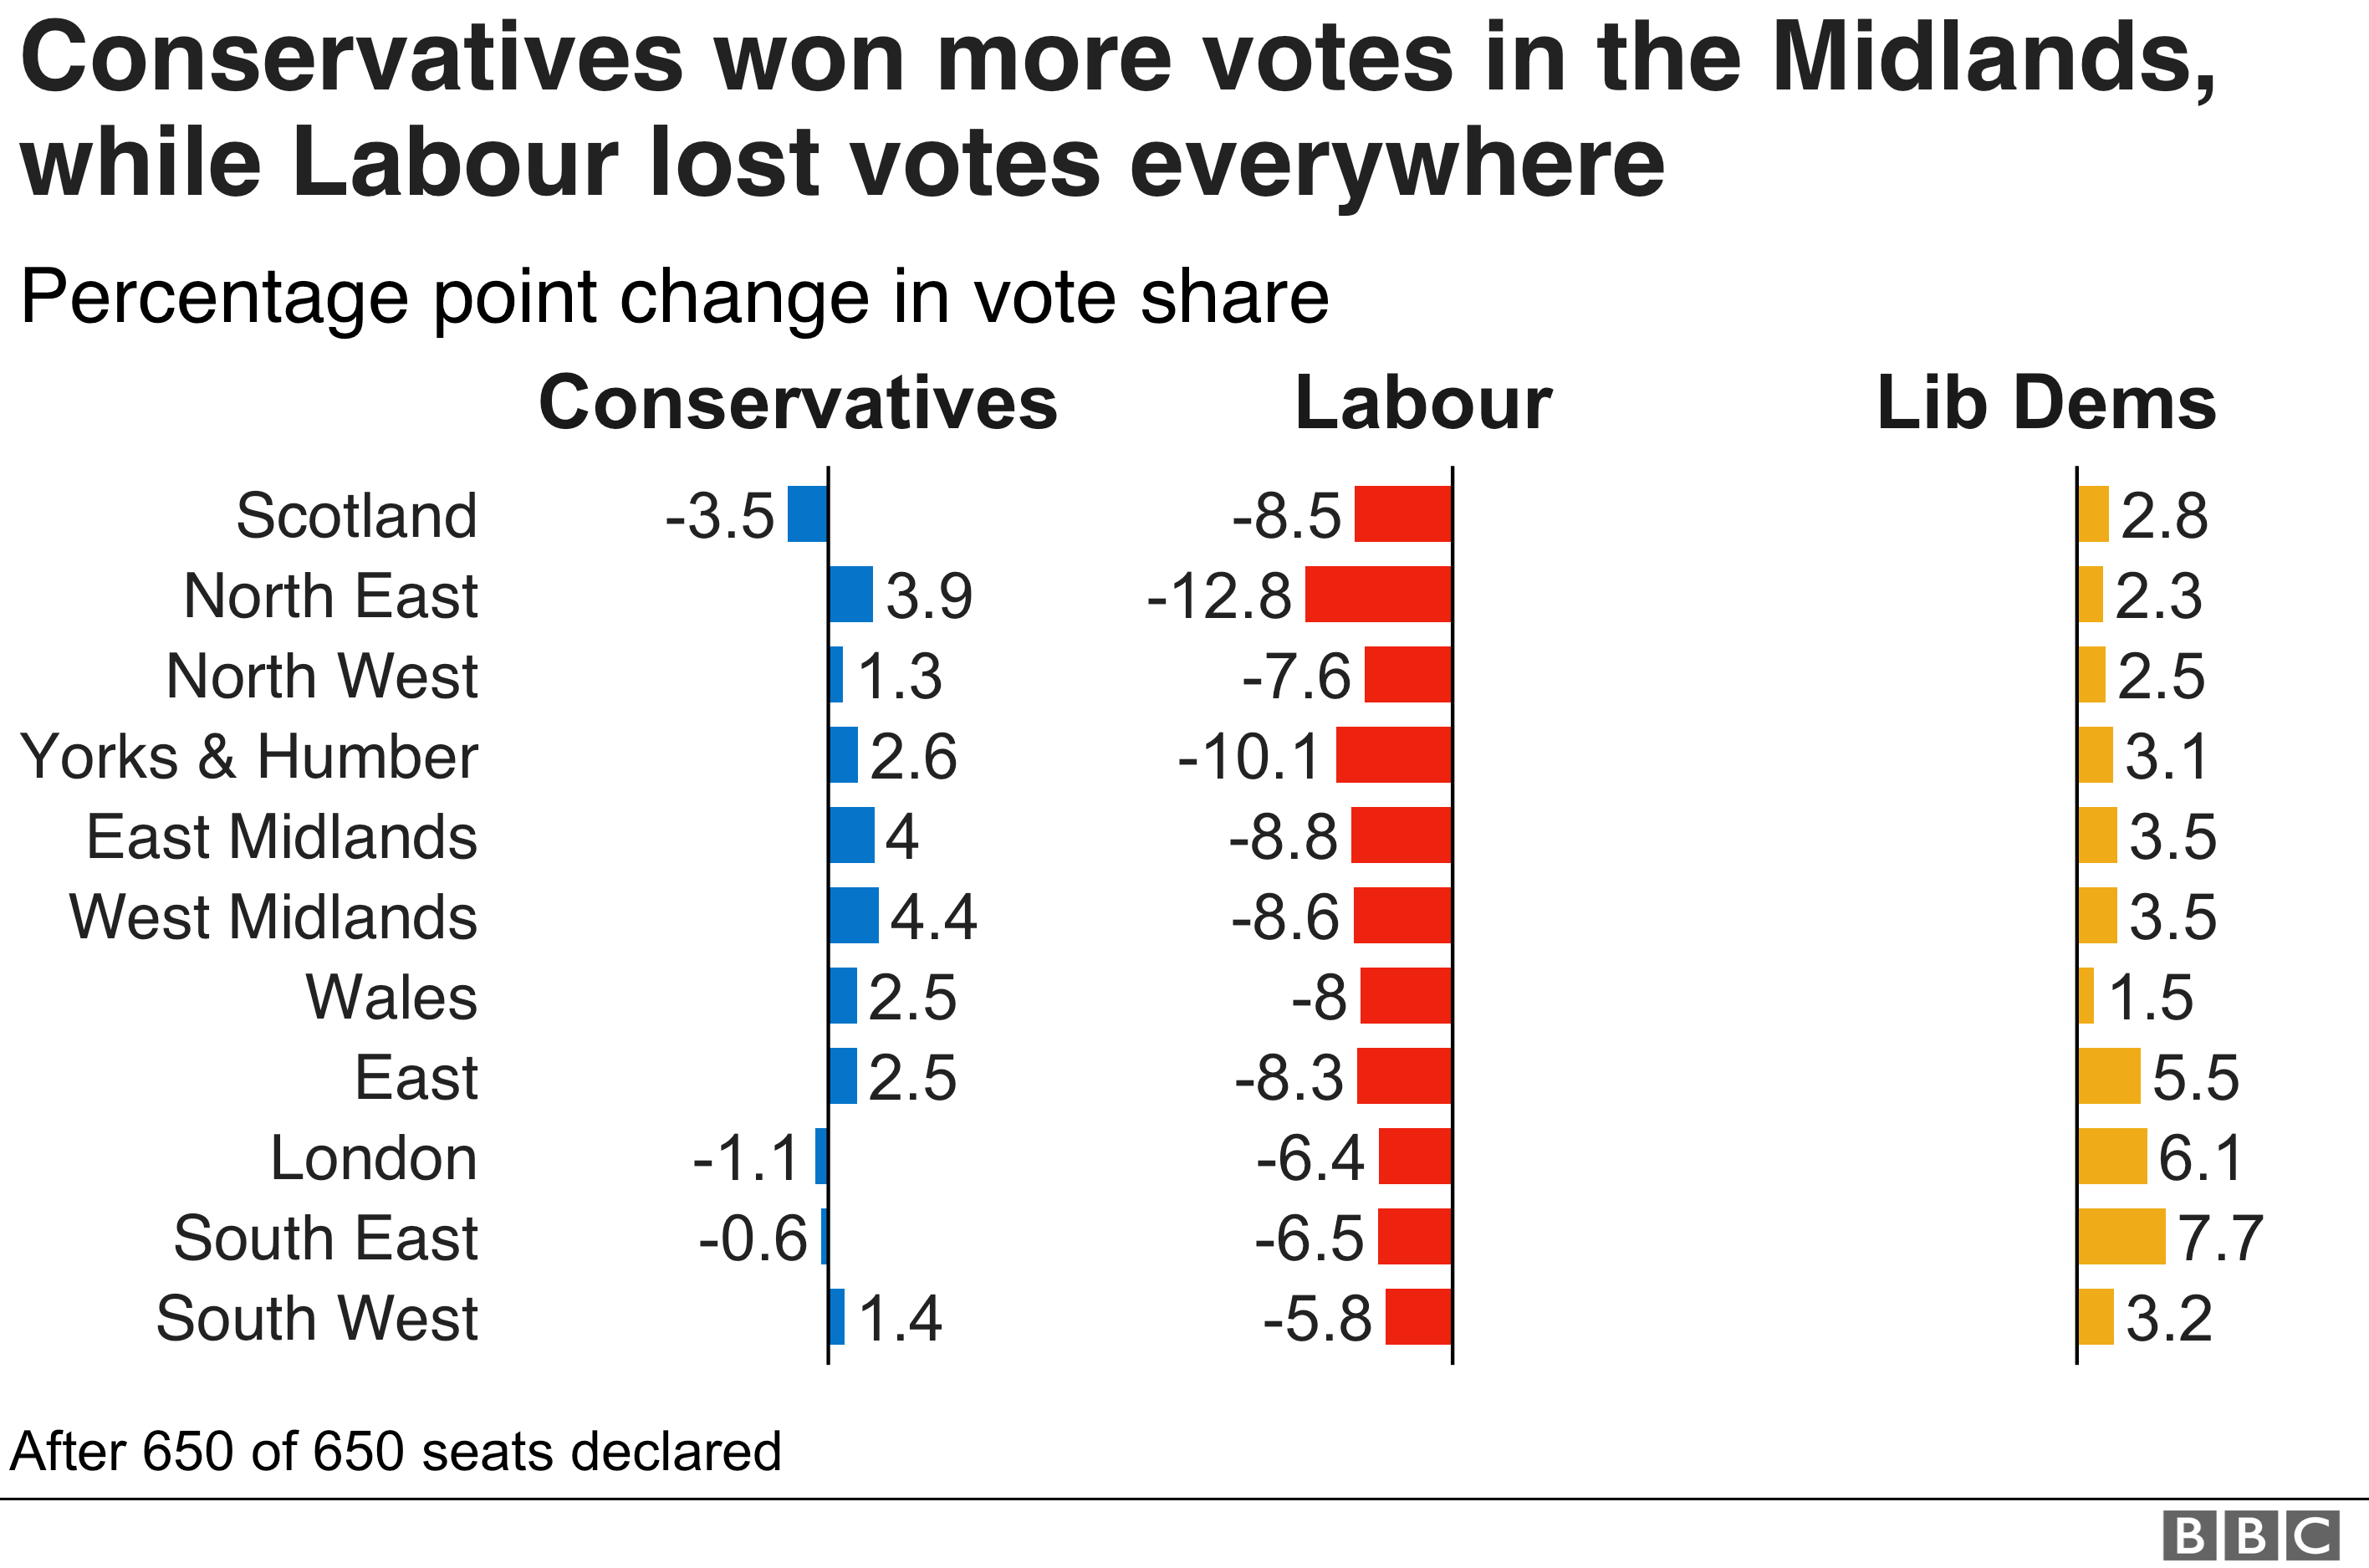
In every nation and region of Britain, the scale of Labour's losses outweighed any gains made by the Conservatives.
The Conservatives did lose votes in the south of England and Scotland, but these were balanced by gains in the rest of England and Wales.
The Lib Dems increased their share of the vote across the UK, but failed to translate these gains into more seats.
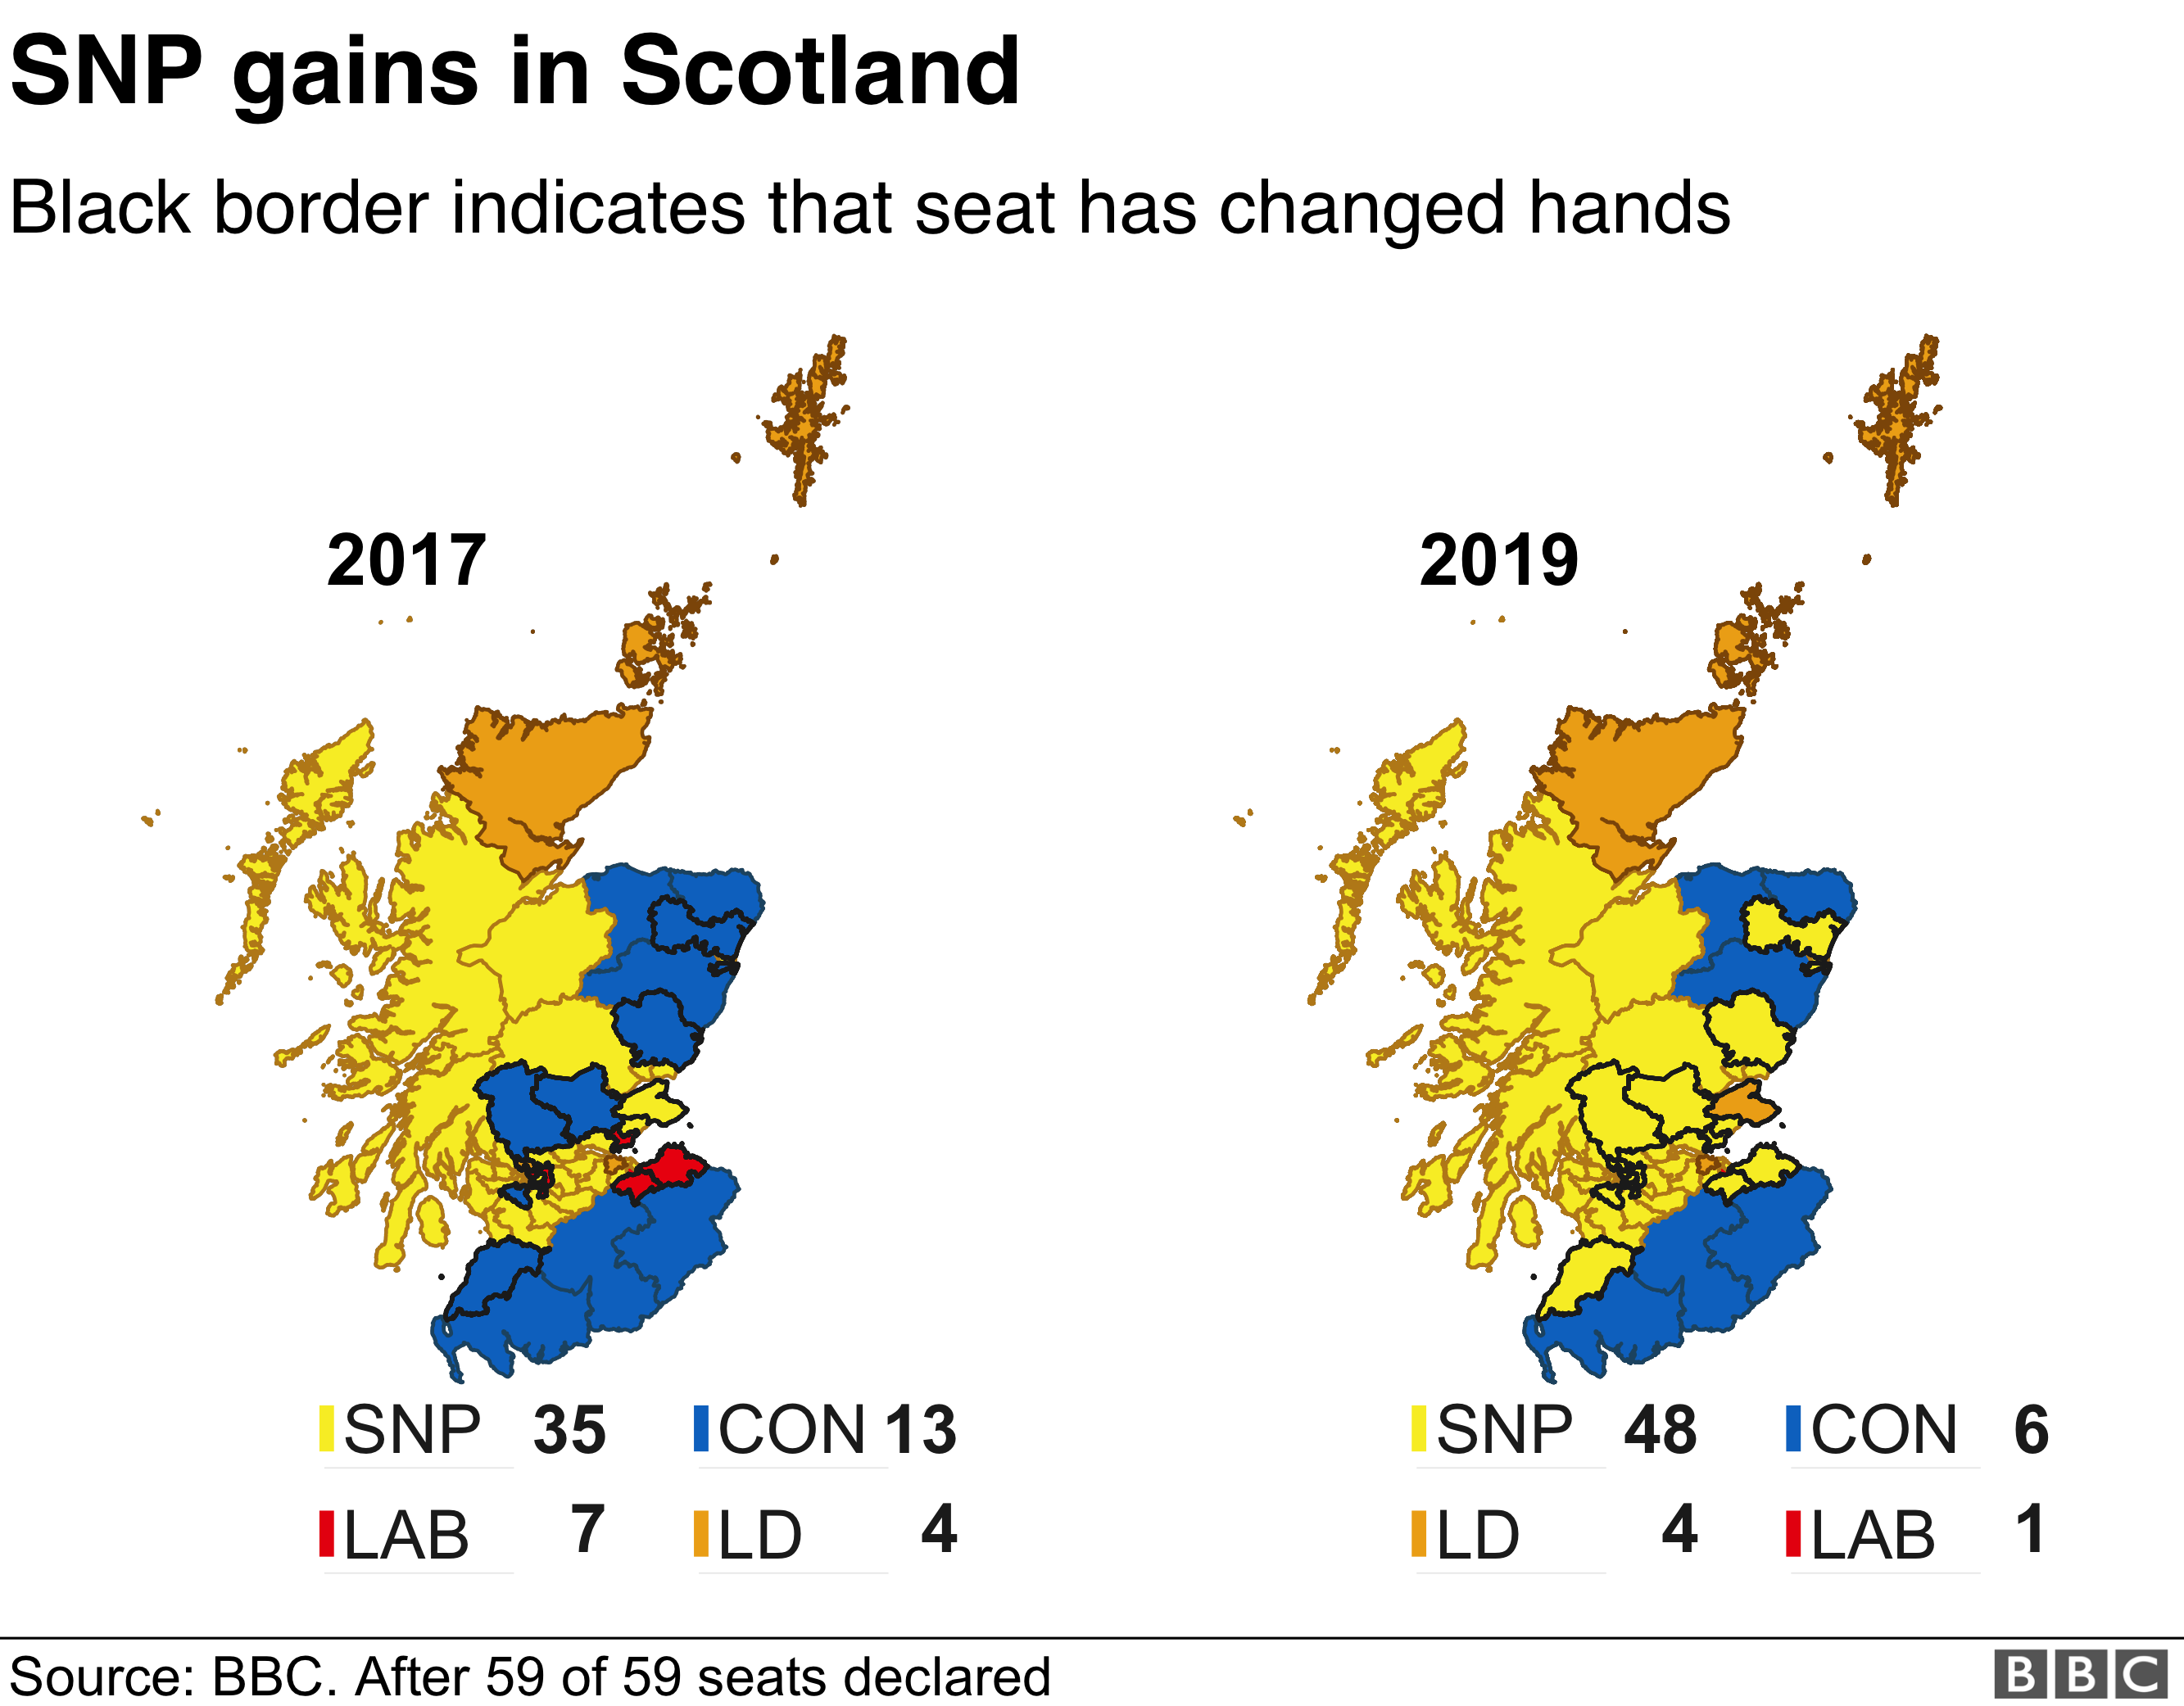
In Scotland, the SNP made 14 gains, and lost just one seat, while the Conservatives lost seven and Labour lost six seats.
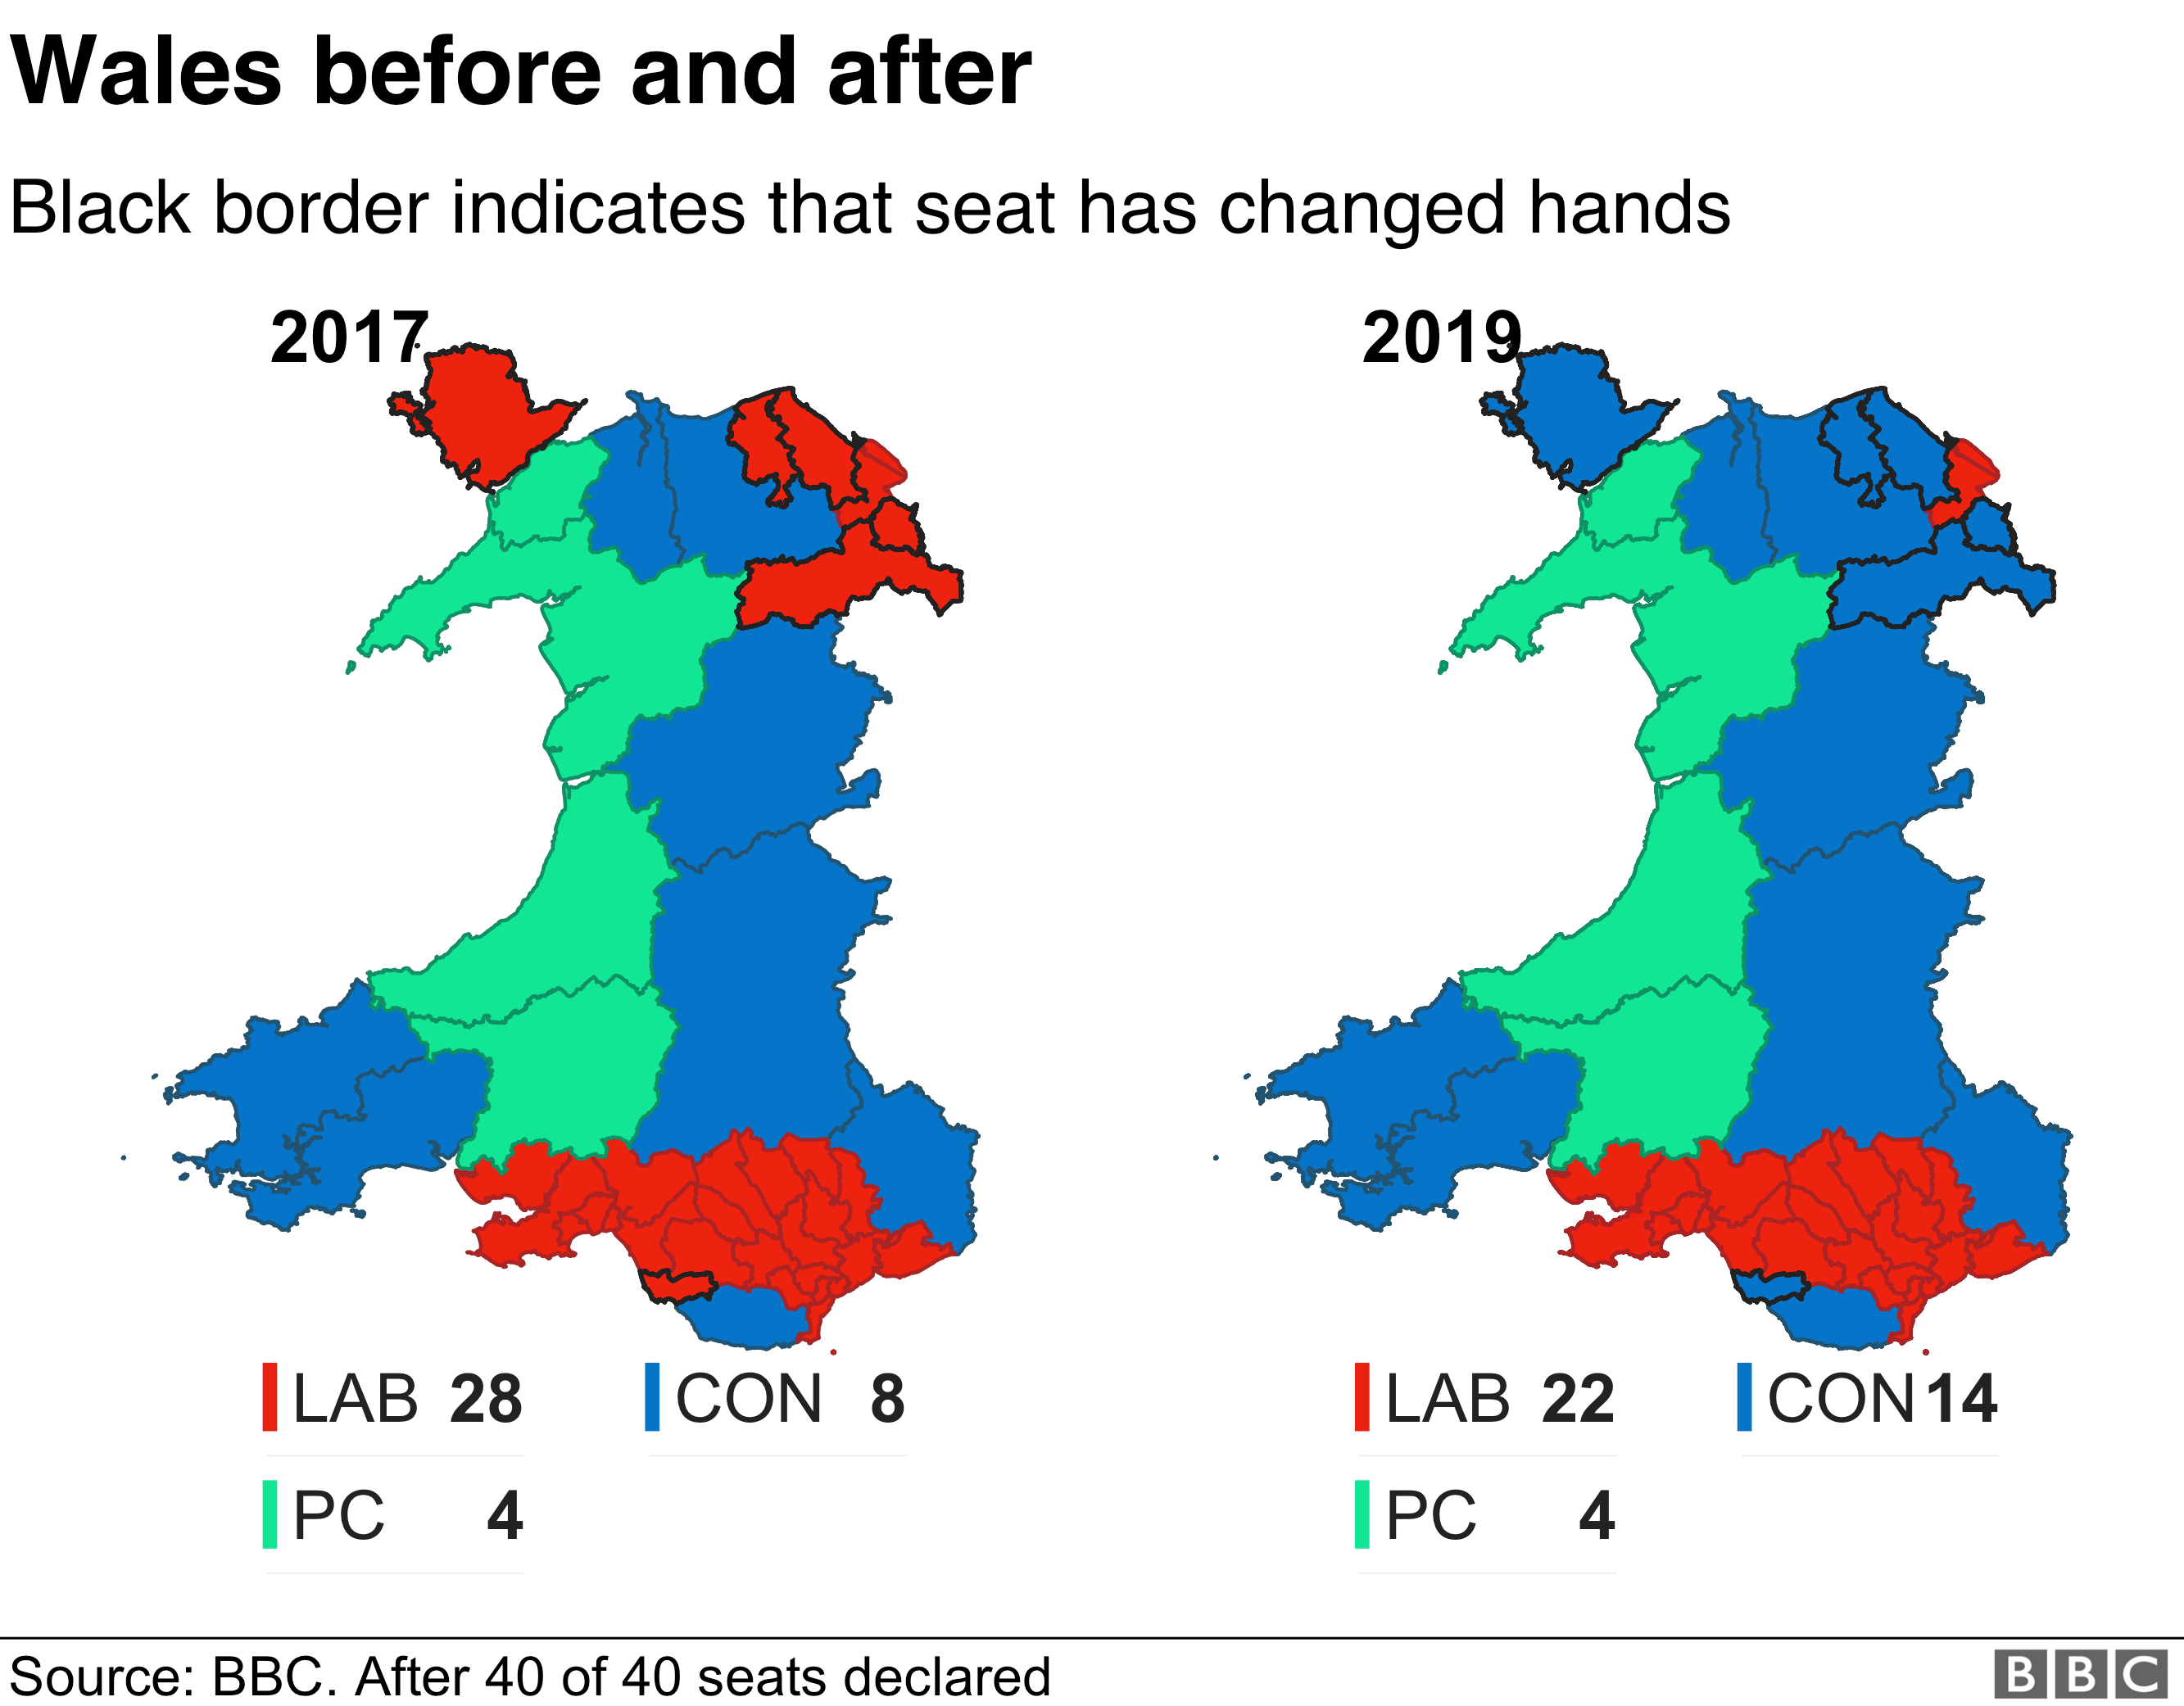
In Wales, the Conservatives gained six seats and Labour lost six, mostly in the north east. Overall, Labour's share of the vote was down to 41% from 49% in 2017.
The Conservatives polled consistently well across England and most of Wales, reflecting their overall 44% share of the UK vote.
You can use the interactive map below to show the vote share for other parties as well as the turnout.
Labour's strength was concentrated in London and areas around cities in south Wales, the North East and North West. At 32%, Labour's share of the vote is down around eight points on the 2017 general election.
Overall, they lost 60 seats and gained only one, Putney in London.
More women in Parliament
A total of 220 female MPs have been elected. This is 12 more than the previous high of 208 in 2017.
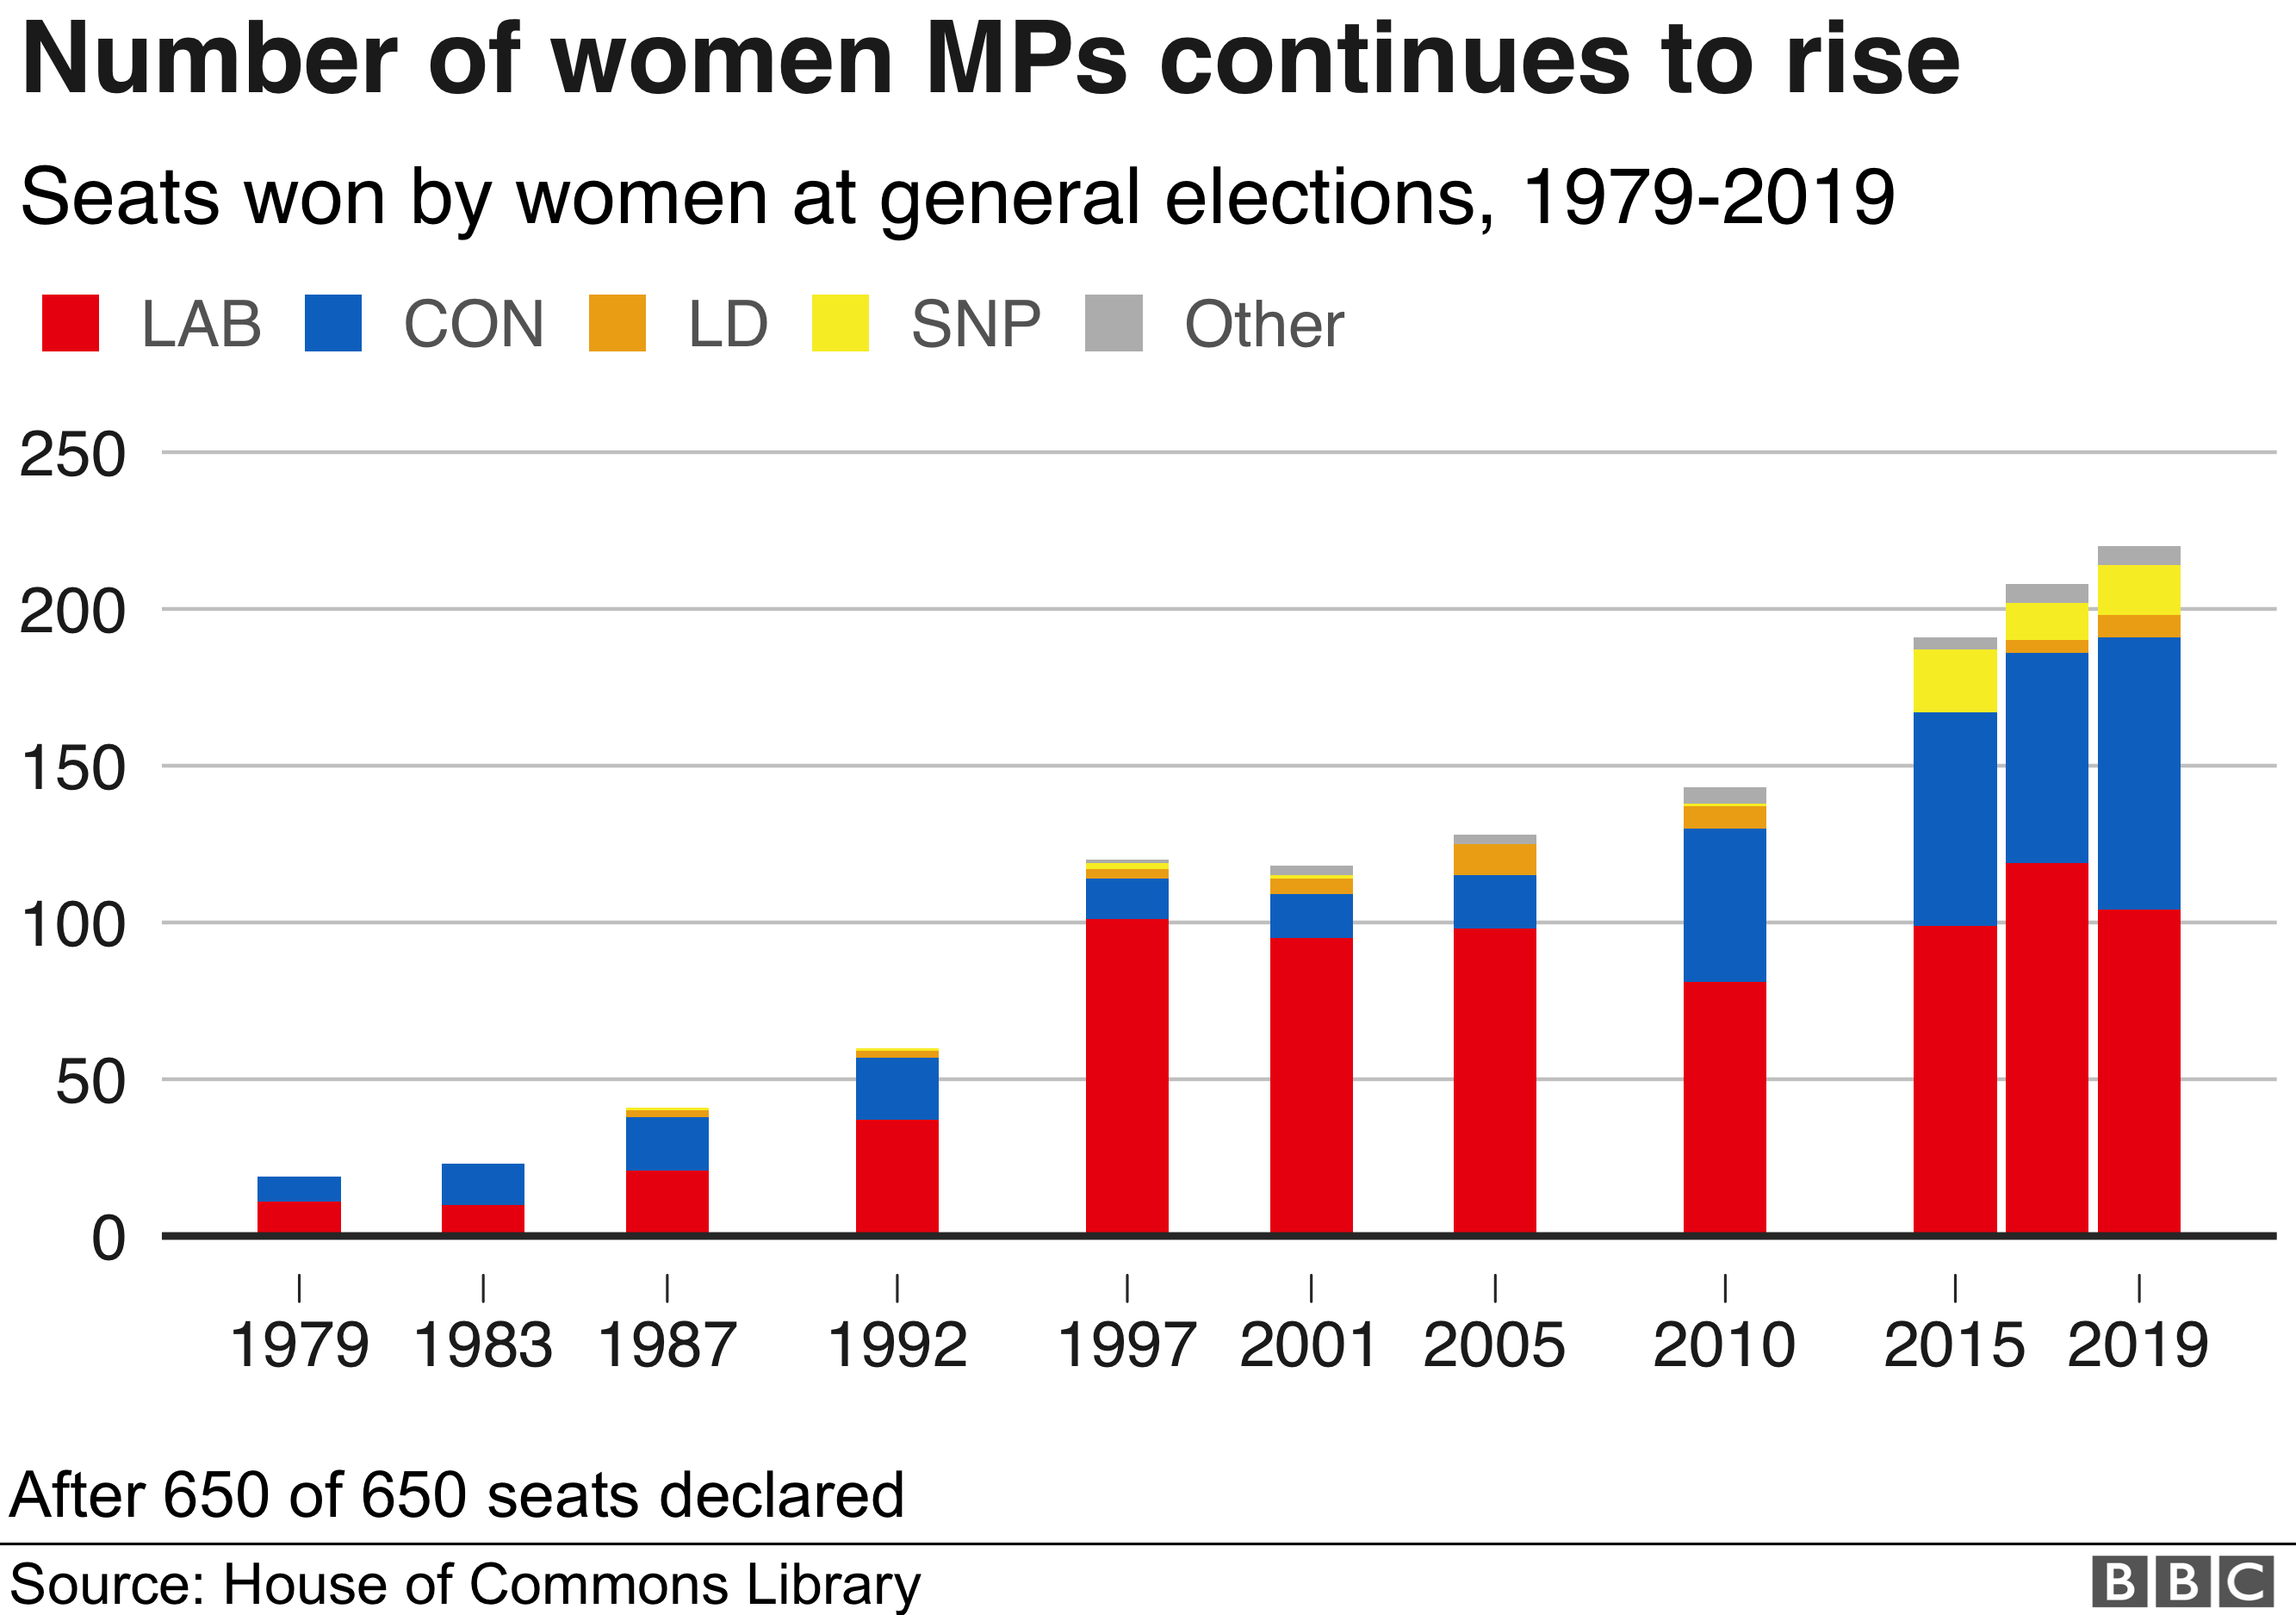
For the first time, both the Liberal Democrats and Labour have more women MPs than men. Of Labour's 202 MPs (excluding Speaker Lindsay Hoyle), 104 are women and of the Liberal Democrats' 11 MPs, seven are women.
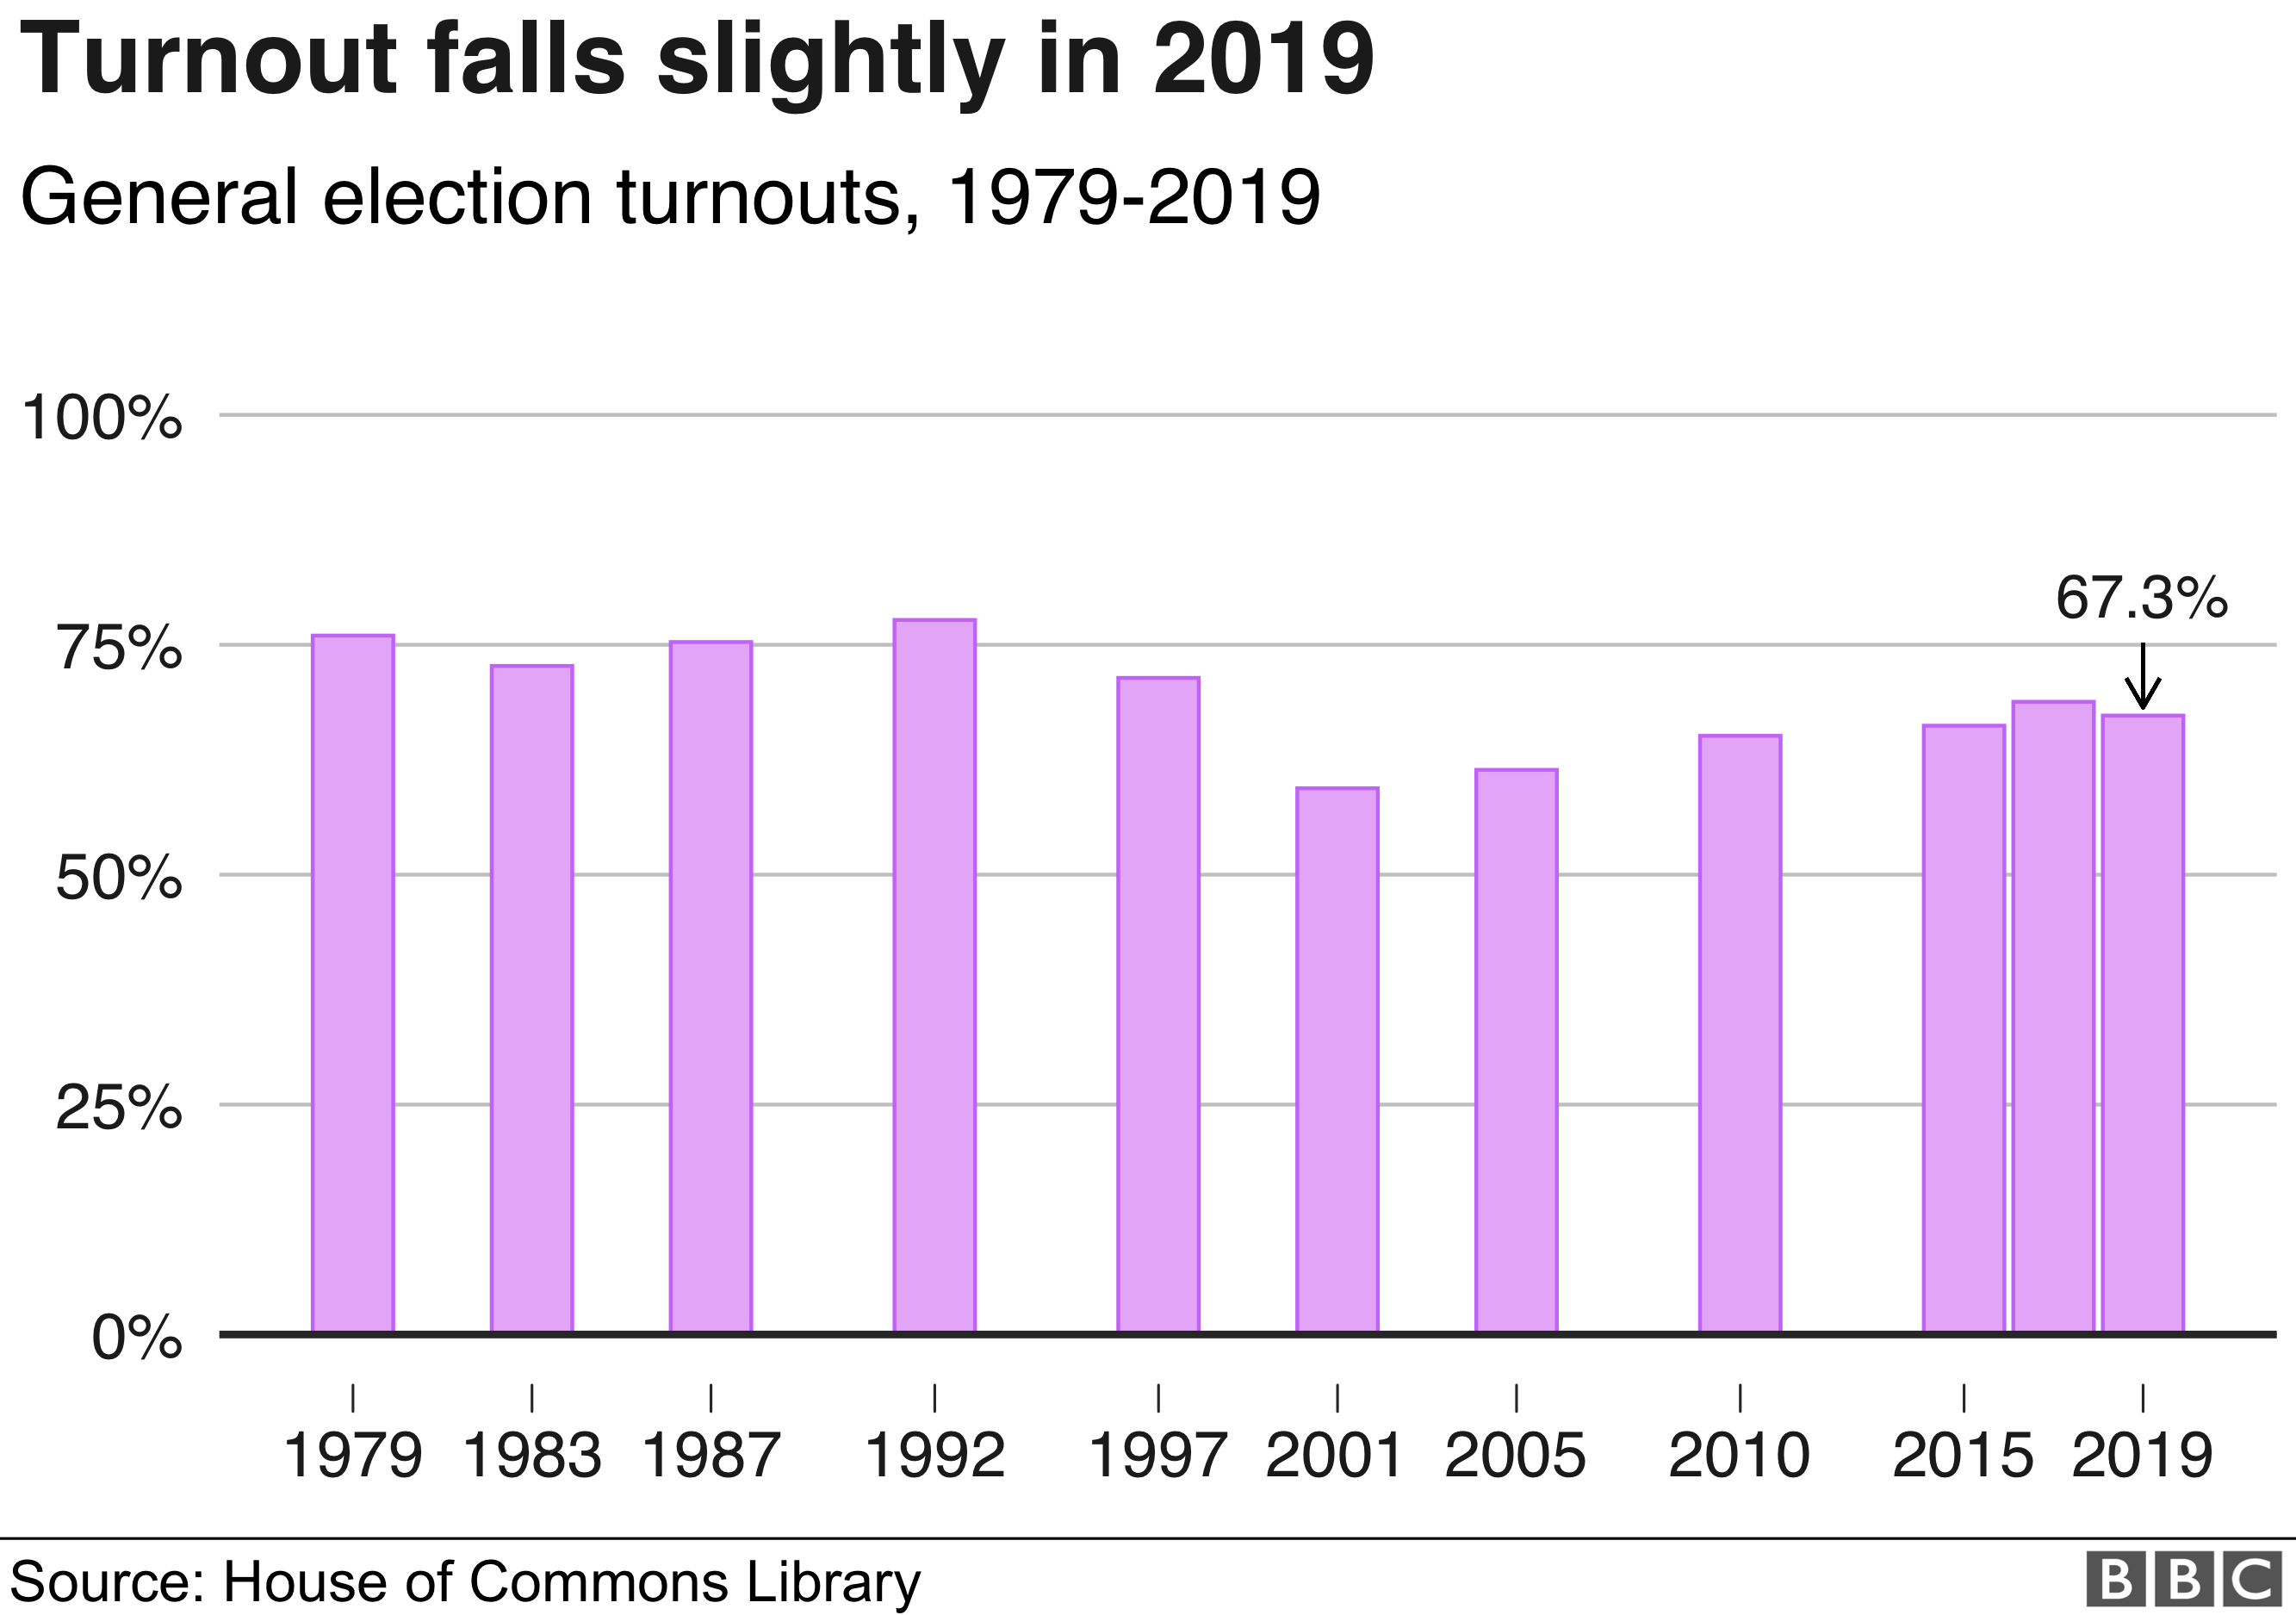
Turnout
Turnout, on what was a cold and damp polling day, was 67.3%. slightly lower than the last election in June 2017.
Analysis by Daniel Dunford, Wesley Stephenson, Irene de la Torre Arenas, Becky Dale, Chris Jeavans, Will Dahlgreen, Maryam Ahmed, Ed Lowther, Robert Cuffe, John Walton
https://www.bbc.com/news/election-2019-50770798
Results at-a-glance